HOME >> News >> Industry Information
Drill Stem Test Pressure Chart (DST/tools) |
[ Time:2018-07-18 | Hits:1657 ] |
| Drill Stem Test Pressure Chart (DST Pressure Chart) Drill Stem Test Pressure Chart is a chart created while performing Drill Stem Test (DST). A DST is a systematic procedure for evaluating the hydrocarbon potential of a reservoir. Usually tools are involved in: slip joint, circulating valve,tester valve(locked/hold open position optional) safety joint, packer. This test is a valuable and cost-effective test that is mainly employed in exploratory wells. The main objective of the test is to study the reservoir characteristics as well as evaluate the commercial aspects of the reservoir.
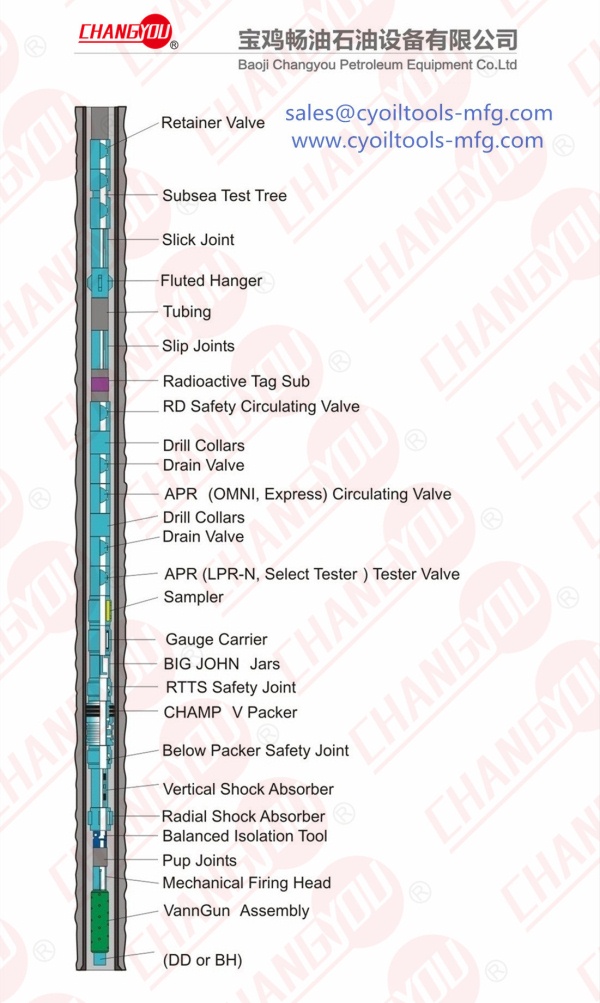
DST tools string- Full flu/bore/open;pressure control
Petropedia explains Drill Stem Test Pressure Chart (DST Pressure Chart) Analysis of Drill Stem Test is performed by Drill Stem Test Pressure Charts. Below are charts that depict the pressure graph with respect to time during different situations in DST. 1.This is a perfect chart. The pressure gauge is located inside but above the closing tool. Here, 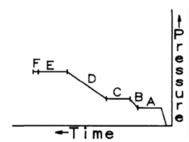 A= addition of cushion or run in a hole B= initial hydrocarbon flow period C= initial shut-in period D= final hydrocarbon flow period E= final shut-in period F= pullout of pressure gauge from hole 2.This chart represents leakage of Collar. The pressure gauge is located inside but above the closing tool. It indicates pressure increase during shut-in periods and running in hole. 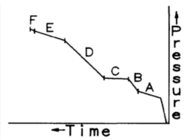 3.This represents loss of fluid from the drill pipe. The pressure gauge is located inside but above the closing tool. Such cases arise when the bleeder valve is left open on the drill string during shut-in periods. 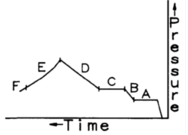 4.This represents a perfect chart. The pressure gauges are located inside above and outside below the closing tool. They help in analyzing transient pressure. Here, 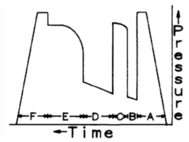 A= run in a hole B= initial hydrocarbon flow period C= initial pressure buildup D= final hydrocarbon flow period E= final pressure buildup F= release of packer and pulling it out of hole 5.This represents a perfect chart. The pressure gauge is placed below the bottom packer on a straddle test. 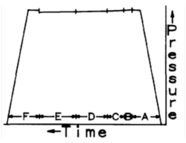 A= run in a hole B= initial hydrocarbon flow period C= initial pressure buildup D= final hydrocarbon flow period E= final pressure buildup F= pulling packer out of hole 6.This represents failure of bottom packer. When this occurs, the pressure gauge will show some flow reading and buildup some pressure data but will not replicate gauges run above the bottom packer due to restricted hydrocarbon flow area around the packer elements. 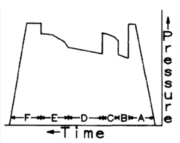
(From petropedia) |